Smart production through data integration
In today's data-driven world, manufacturing companies are faced with the challenge of using large amounts of operating and machine data efficiently. This data is often stored in isolated systems, which makes holistic analysis difficult. Deploying a central data lake with integrated data visualization using dashboards provides a powerful solution for aggregating, analyzing, and presenting data from various sources in real time. In the following, we look at how such an approach can be implemented technologically, what opportunities this offers for companies and which problems can be solved as a result
Reaction instead of prevention: problems of distributed production data
Many companies store their production data in separate systems such as machine control systems, ERP systems or Excel spreadsheets. Without a central platform, there is no quick overview and the ability to make data-driven decisions. Distributed storage means that different departments work with different data sets, which causes inconsistencies and makes reconciliation difficult. Data is often available in proprietary formats, making access and further processing by other systems or applications complicated. In many cases, data silos have arisen in which individual departments have only limited access to relevant information. This makes cross-departmental analysis almost impossible, which hinders efficiency and innovative strength. Employees often have to laboriously export and manually merge data, which is time-consuming and is highly susceptible to errors. Since many systems do not allow automated data processing, it is necessary to manually generate regular reports and analyses, which is not only inefficient but also prone to errors.
Another key problem is that many companies act reactively rather than proactively. Without a central data platform, problems are only identified when they have already led to production outages or high costs. The lack of a uniform data basis makes it difficult to identify connections between various influencing factors and to take preventive measures. Machine downtimes, quality deficiencies or inefficient use of resources are often only identified when the effects are already noticeable. Preventive analysis in real time can help identify and avoid failures and inefficiencies at an early stage.
Data integration as a driver for intelligent production
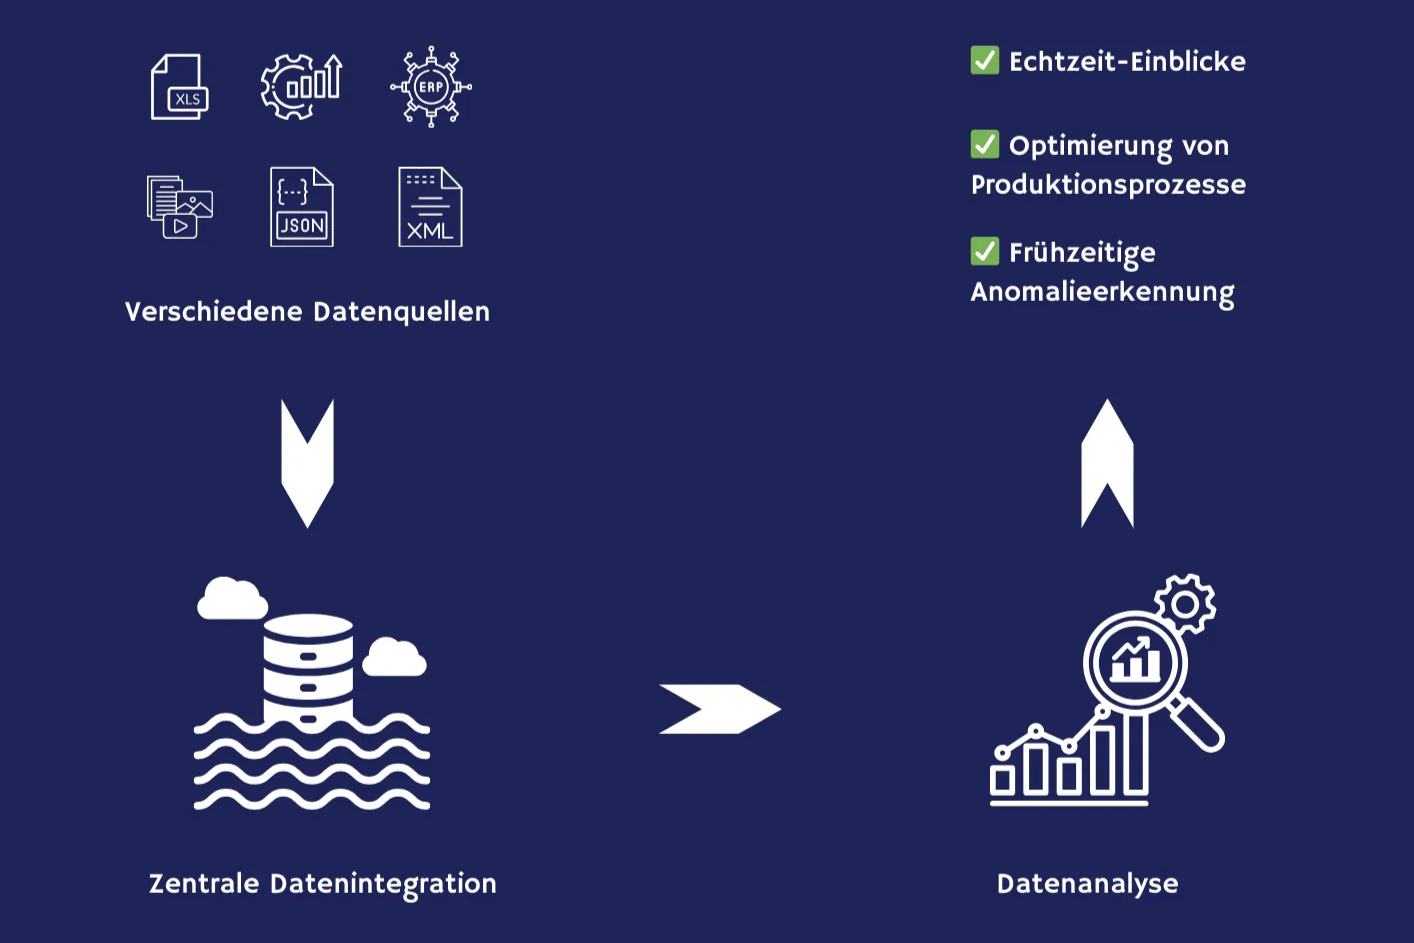
A data lake makes it possible to store large amounts of structured and unstructured data from various sources. Production data from machine control systems, IoT devices, ERP systems or quality control systems can be stored centrally to create a uniform data basis. By integrating this data and visualizing it, companies are able to monitor relevant key figures in real time and make data-driven decisions.
Modern data lakes offer a flexible data architecture that can process both historical and real-time data. This allows continuous analysis of machine states, production utilization and energy costs. By using machine learning algorithms, patterns and trends can be identified that can be used for predictive maintenance. This reduces unplanned downtimes and improves production efficiency.
Another benefit is the ability to create custom dashboards for different stakeholders. While management needs access to aggregated business indicators, production managers want to see detailed analyses of machine run times and scrap rates. IT departments benefit from a centralized platform that ensures data integration and security requirements.
By implementing intelligent notification systems, production workers can be immediately alerted when critical values are exceeded or machines work outside defined parameters. This enables rapid response to issues and minimizes downtime. In addition, automated reports and compliance checks make it easier to comply with regulatory requirements, such as the GDPR or industry-specific standards.
Basic technological concept
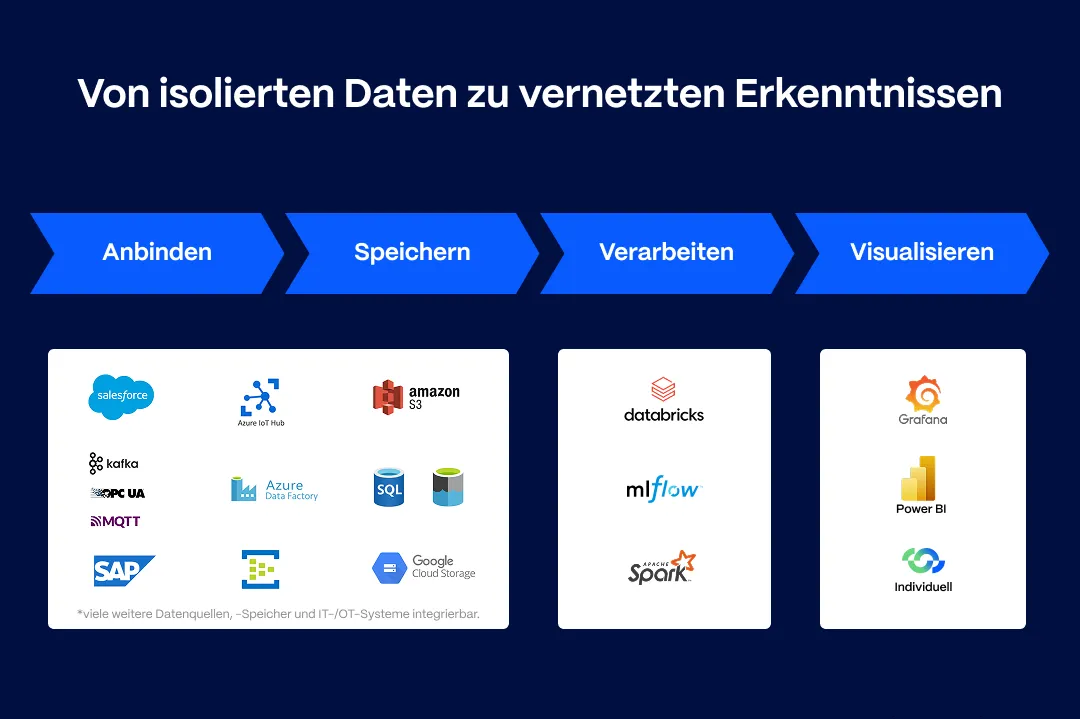
The integration of a data lake with smart dashboards is based on modern cloud technologies. The data connection of various data sources, such as systems and sensors, but also SAP and OPC UA, can be implemented using various cloud technologies. This enables seamless collection of real-time and batch data from various systems, including machine controls, IoT devices, and ERP systems.
Various storage solutions are available for secure and scalable storage in a data lake. Storing data requires the necessary flexibility to efficiently manage both structured and unstructured data.
The data is processed using powerful tools such as Microsoft Fabric, Databricks or Azure ML Studio. These technologies make it possible to transform raw data into usable information. With Databricks, you can build complex data pipelines that enable data cleansing, transformation, and aggregation at scale. Azure ML Studio makes it possible to train machine learning models and carry out predictive analyses, for example to identify anomalies at an early stage and initiate preventive measures.
Finally, interactive dashboards with Power BI ensure an intuitive visualization of production figures. Power BI makes it possible to present real-time data in clear charts, use filter functions and provide custom dashboards for various stakeholders. Management, production management and IT teams thus receive a tailored view of relevant indicators that are optimized for their specific requirements.
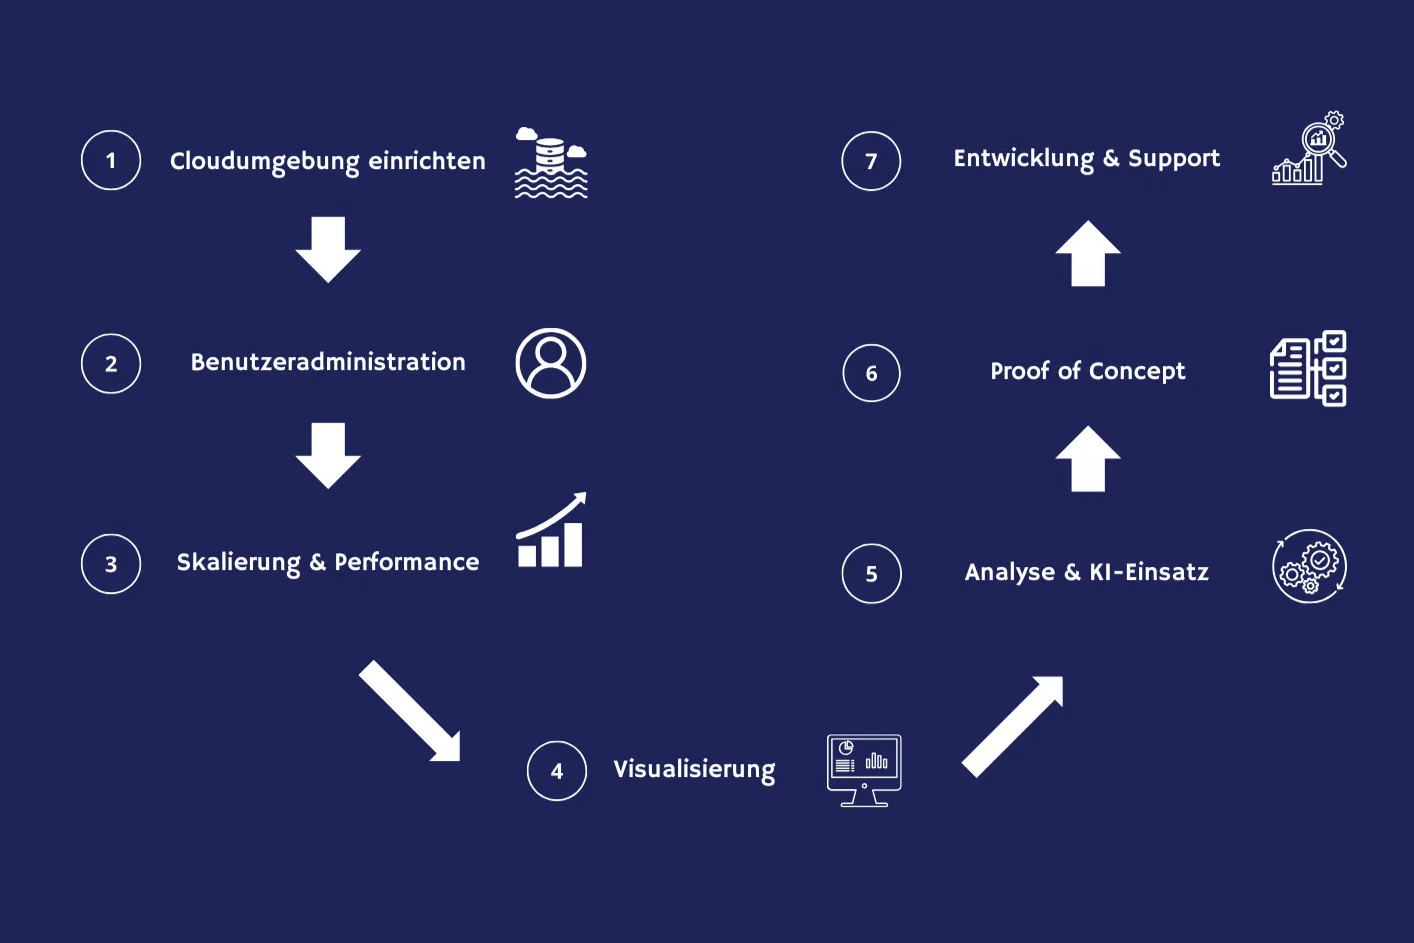
Step by step to intelligent manufacturing with prenode
Step 1: Set up a cloud environment
The successful centralization and visualization of production data requires a well-thought-out and structured approach. The first step is to set up a stable cloud environment. The entire infrastructure is set up in the cloud provider of your choice to ensure secure and scalable storage and processing of data. Production data from machines, sensors and controls is transferred to the cloud in encrypted form. A central instance ensures that multiple customers can use the same platform, with strict access control ensuring that only authorized users access the respective data.
Step 2: User Management
Another essential step is user administration and authentication. Here, an identity provider is set up to log on external customers in order to regulate access to the system. A rudimentary user administration with an admin role enables initial control of user rights, and an automated self-service function can be provided for later expansions.
Step 3: Scale and Performance
The scalability and performance of the platform have been central concerns right from the start. At the beginning, the architecture should be designed so that it can be scaled to suit your needs. The focus is initially on rapid implementation in order to create added value for the customer at an early stage. Subsequent optimizations and expansions can be carried out successively as soon as the basic structure is in place.
Step 4: Visualize in dashboards
An intuitive dashboard is being developed for effective use of the collected data. This clearly presents live data from the systems and makes it possible to record important key figures at a glance. The dashboard is adapted to the customer's corporate identity and designed in a responsive design so that it can be used optimally on both desktop and mobile devices.
Step 5: Analytics and Machine Learning
In addition, this procedure offers the option of integrating machine learning into the analysis of production data. With technologies such as Azure ML Studio or Databricks, historical data can be used to perform predictive analyses and optimizations. Machine learning models can be continuously trained with new data in order to adapt to changing production conditions and make even more accurate forecasts.
Step 6: Quick PoC
The first version of the platform will be made available to customers within a few months. This early market launch makes it possible to collect valuable feedback and gradually develop the solution. Through iterative development and scaling, the platform can grow in the long term and integrate additional functions and new customer requirements.
Step 7: Support
Another important aspect is the maintenance and support of the platform. prenode maintains the technological components to ensure stable operation and regular updates. This ensures continuous availability and optimized performance.
Conclusion
The integration of data lakes with smart dashboards offers companies a powerful solution to use data efficiently and optimize production. By combining real-time analytics, AI-based forecasts, and automated reports, production managers can make data-driven decisions and increase their competitiveness. We support you from the assessment of requirements, through implementation, to further operation and support.
Share this article